deepseek-ai/DeepSeek-R1-0528 on 8xH200
ScenariosWhat Do the Scenarios Represent?
Each benchmark scenario simulates a different real-world usage pattern with distinct input and output token profiles.
ChatbotRAG / QAAgenticTool Calling AgenticDefinitionsMetric Glossary
Quick definitions for the metrics used throughout this report. All timing metrics are measured on a live streaming endpoint.
Context LengthPrefillDecodeTTFTITLDecode SpeedPer-User vs SystemScaling EfficiencyE2E LatencyBatch Size / ConcurrencyWhen Am I the Fastest?
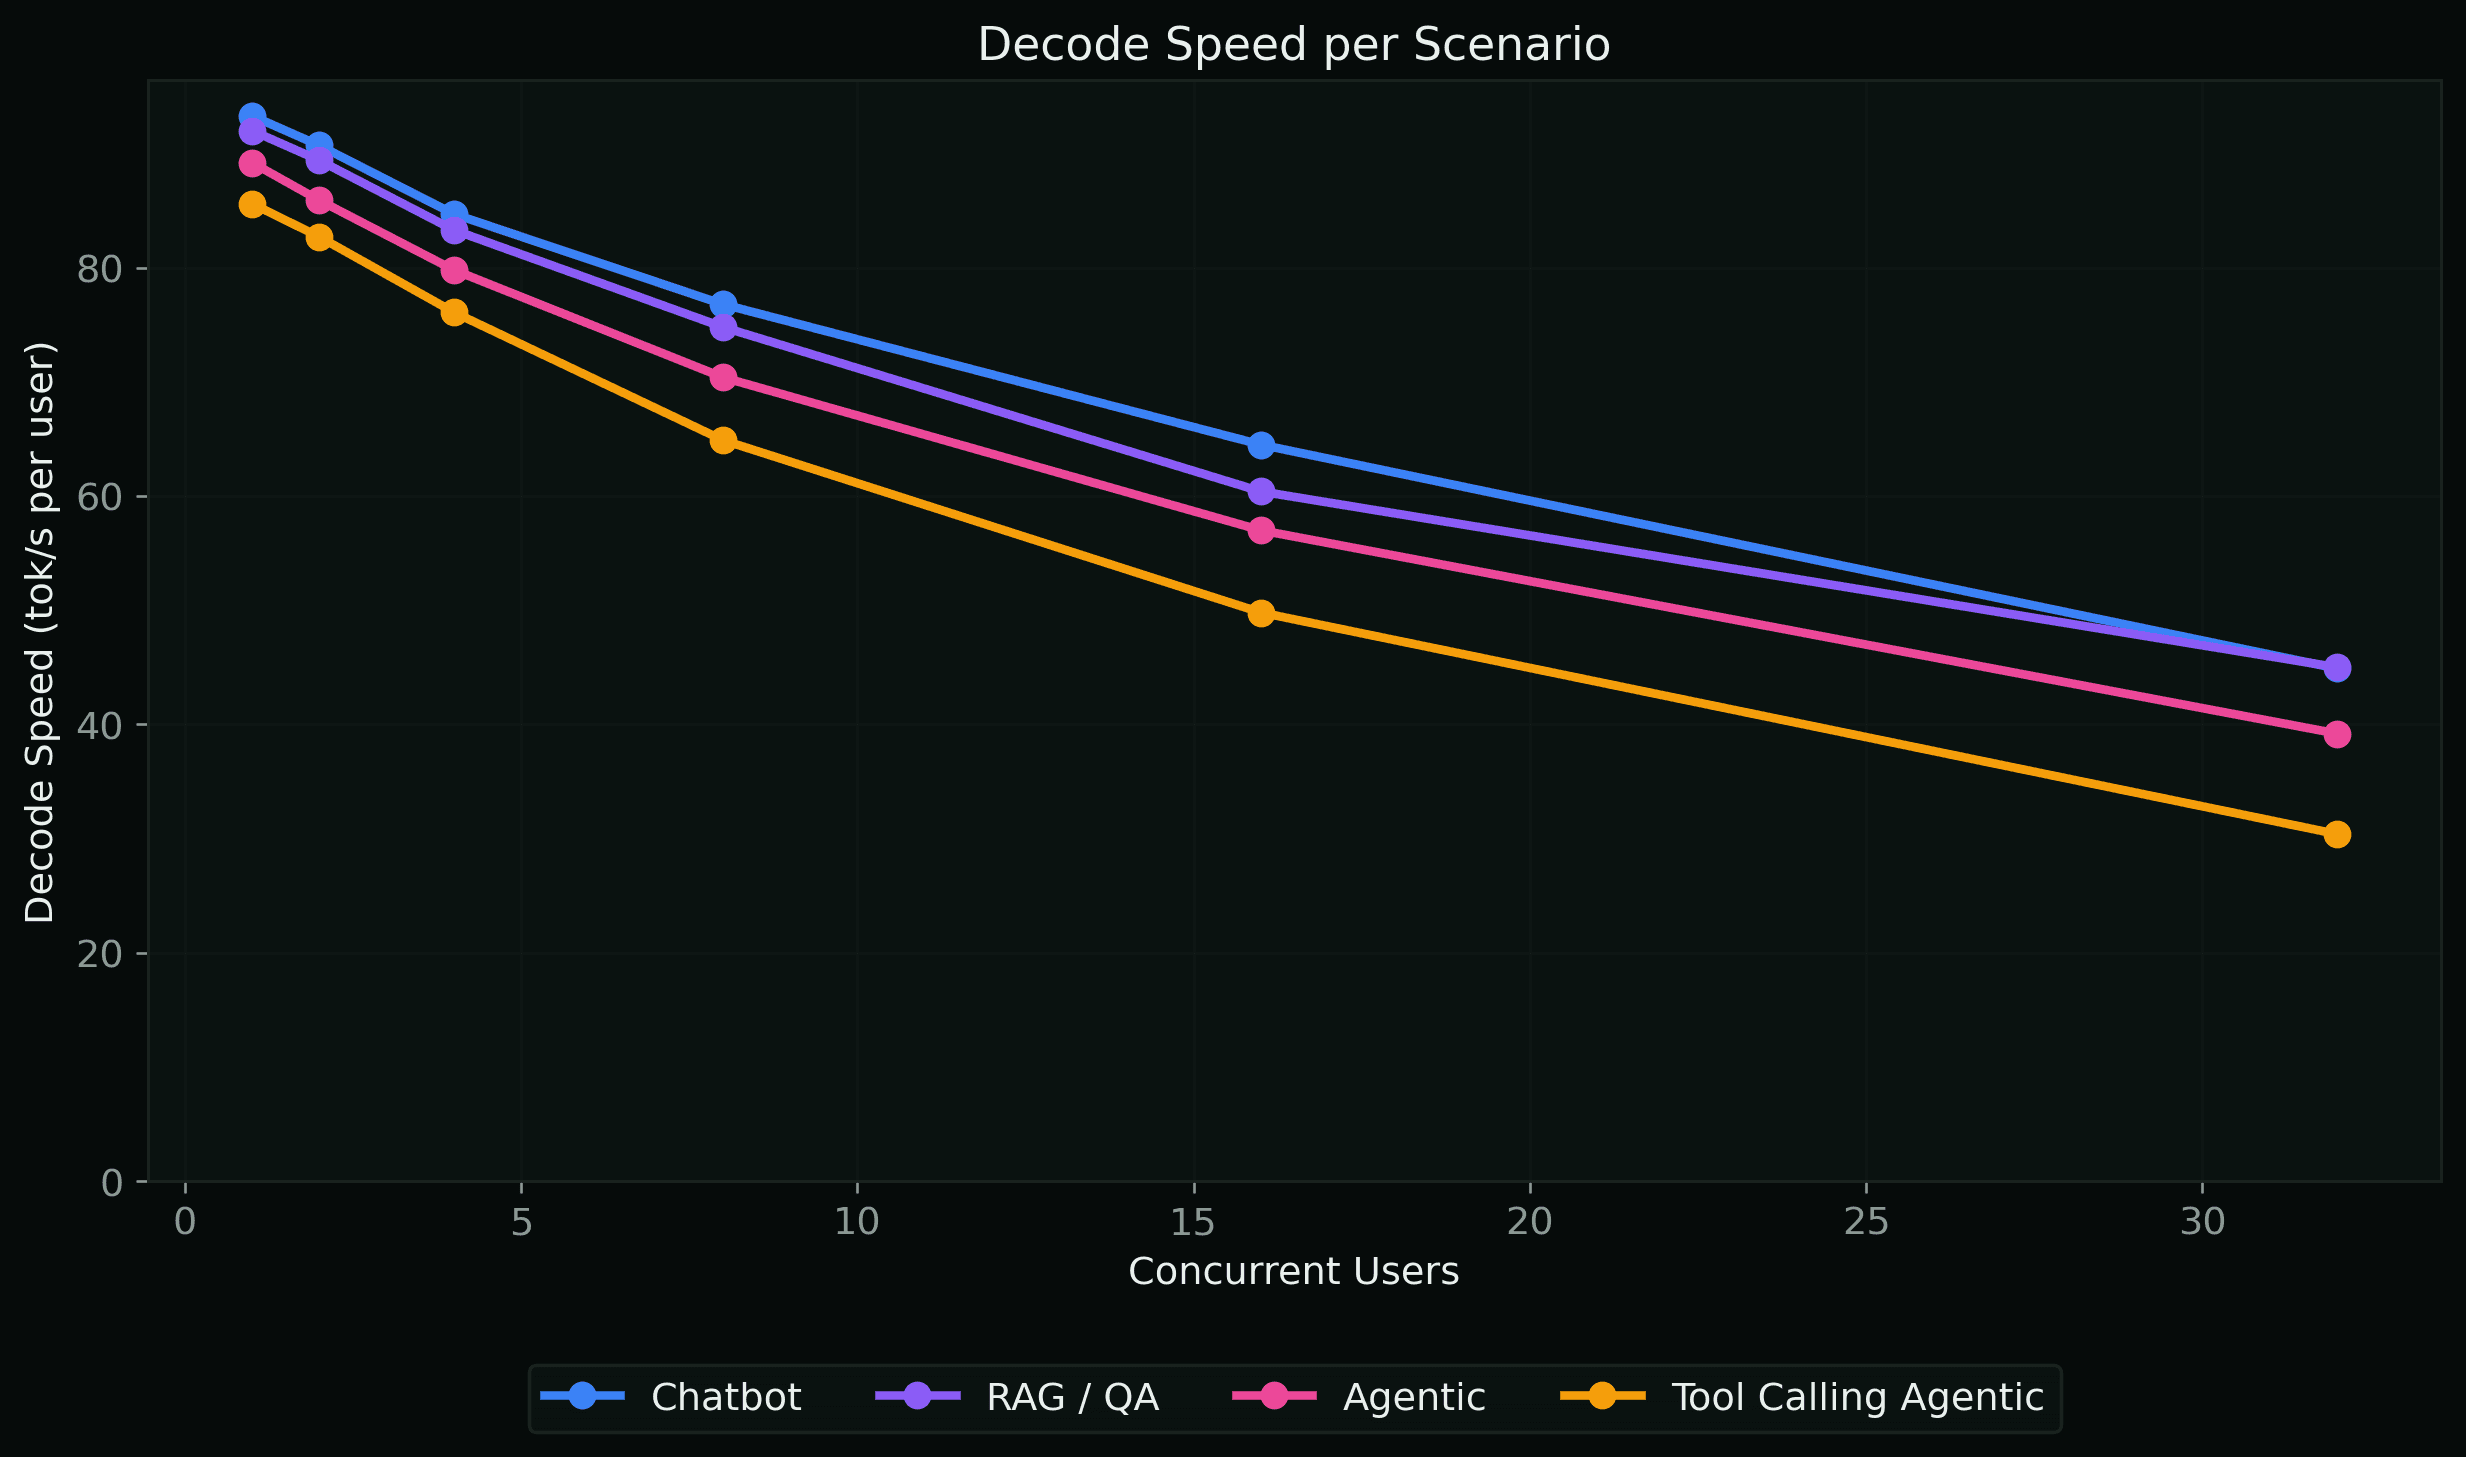
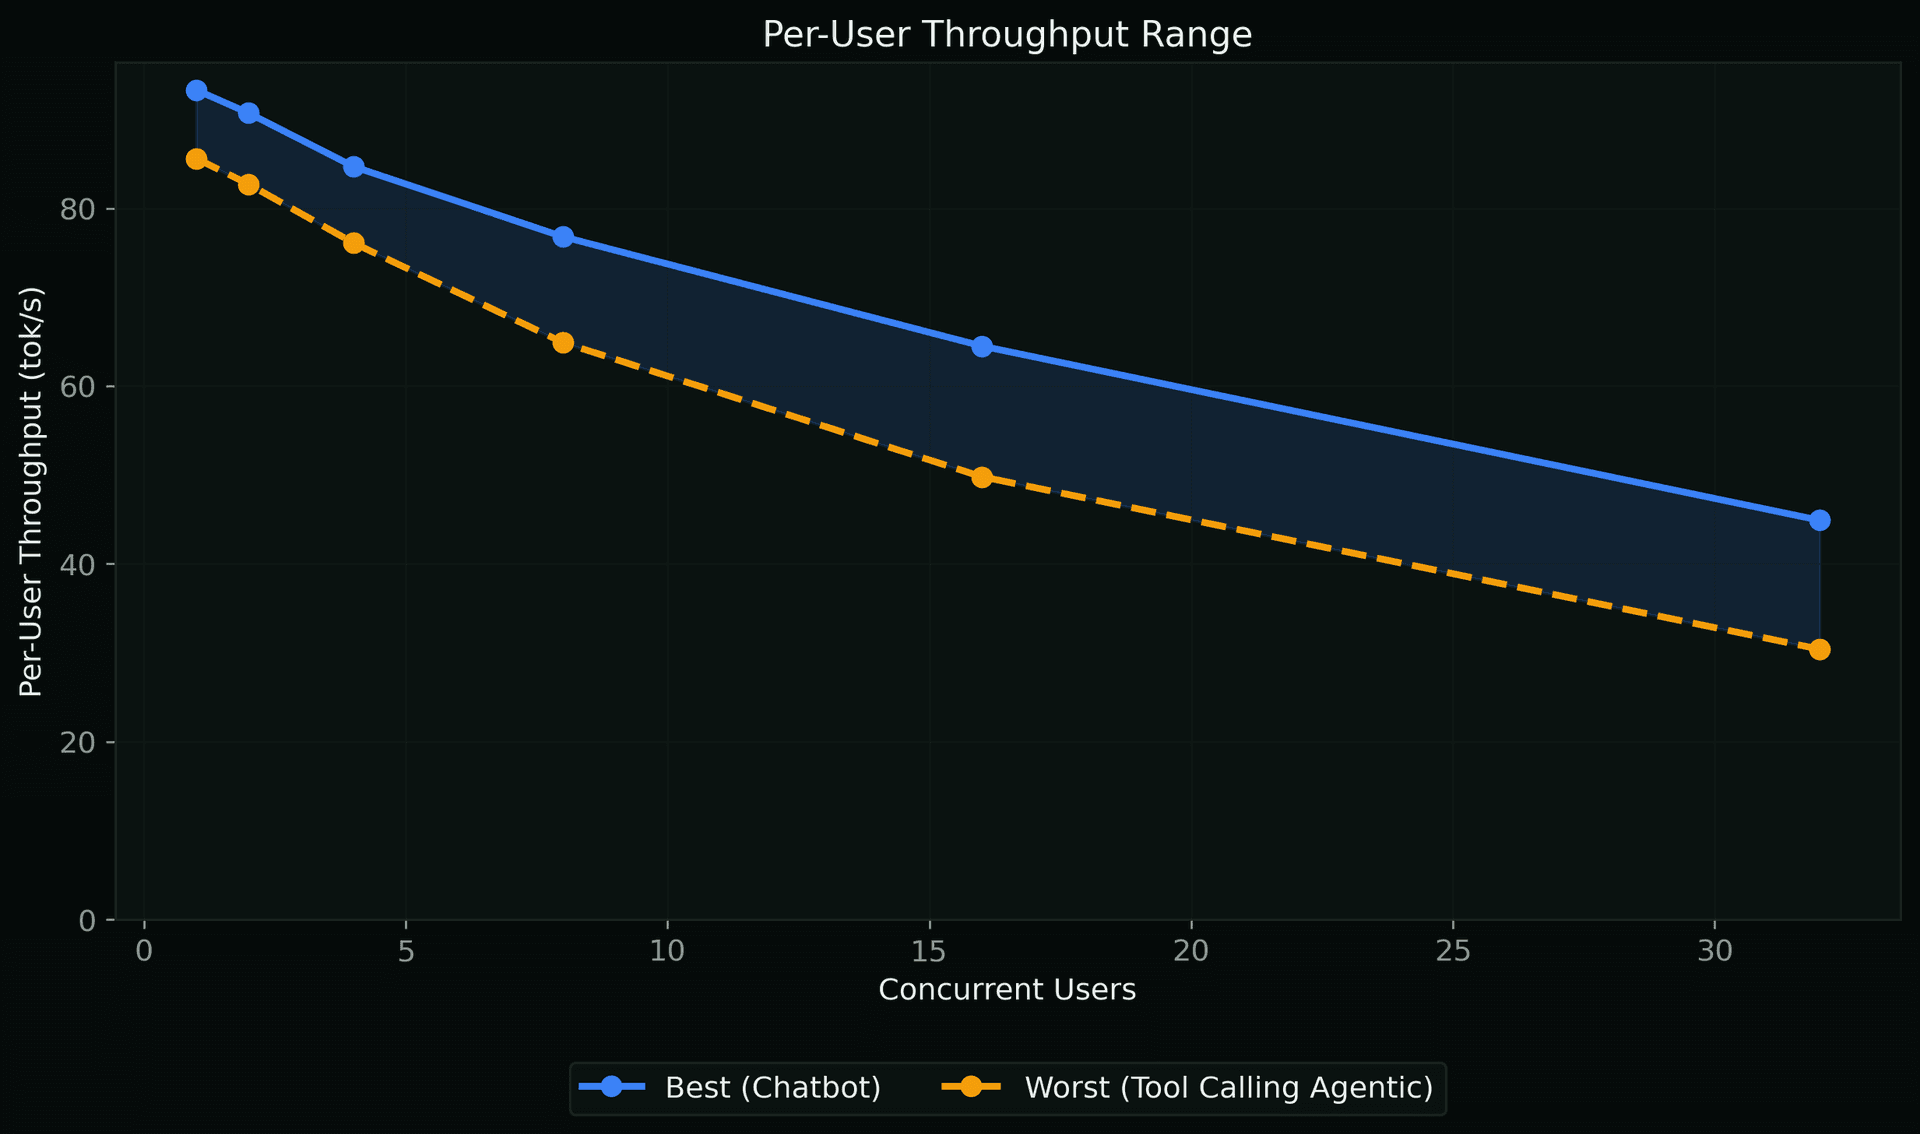
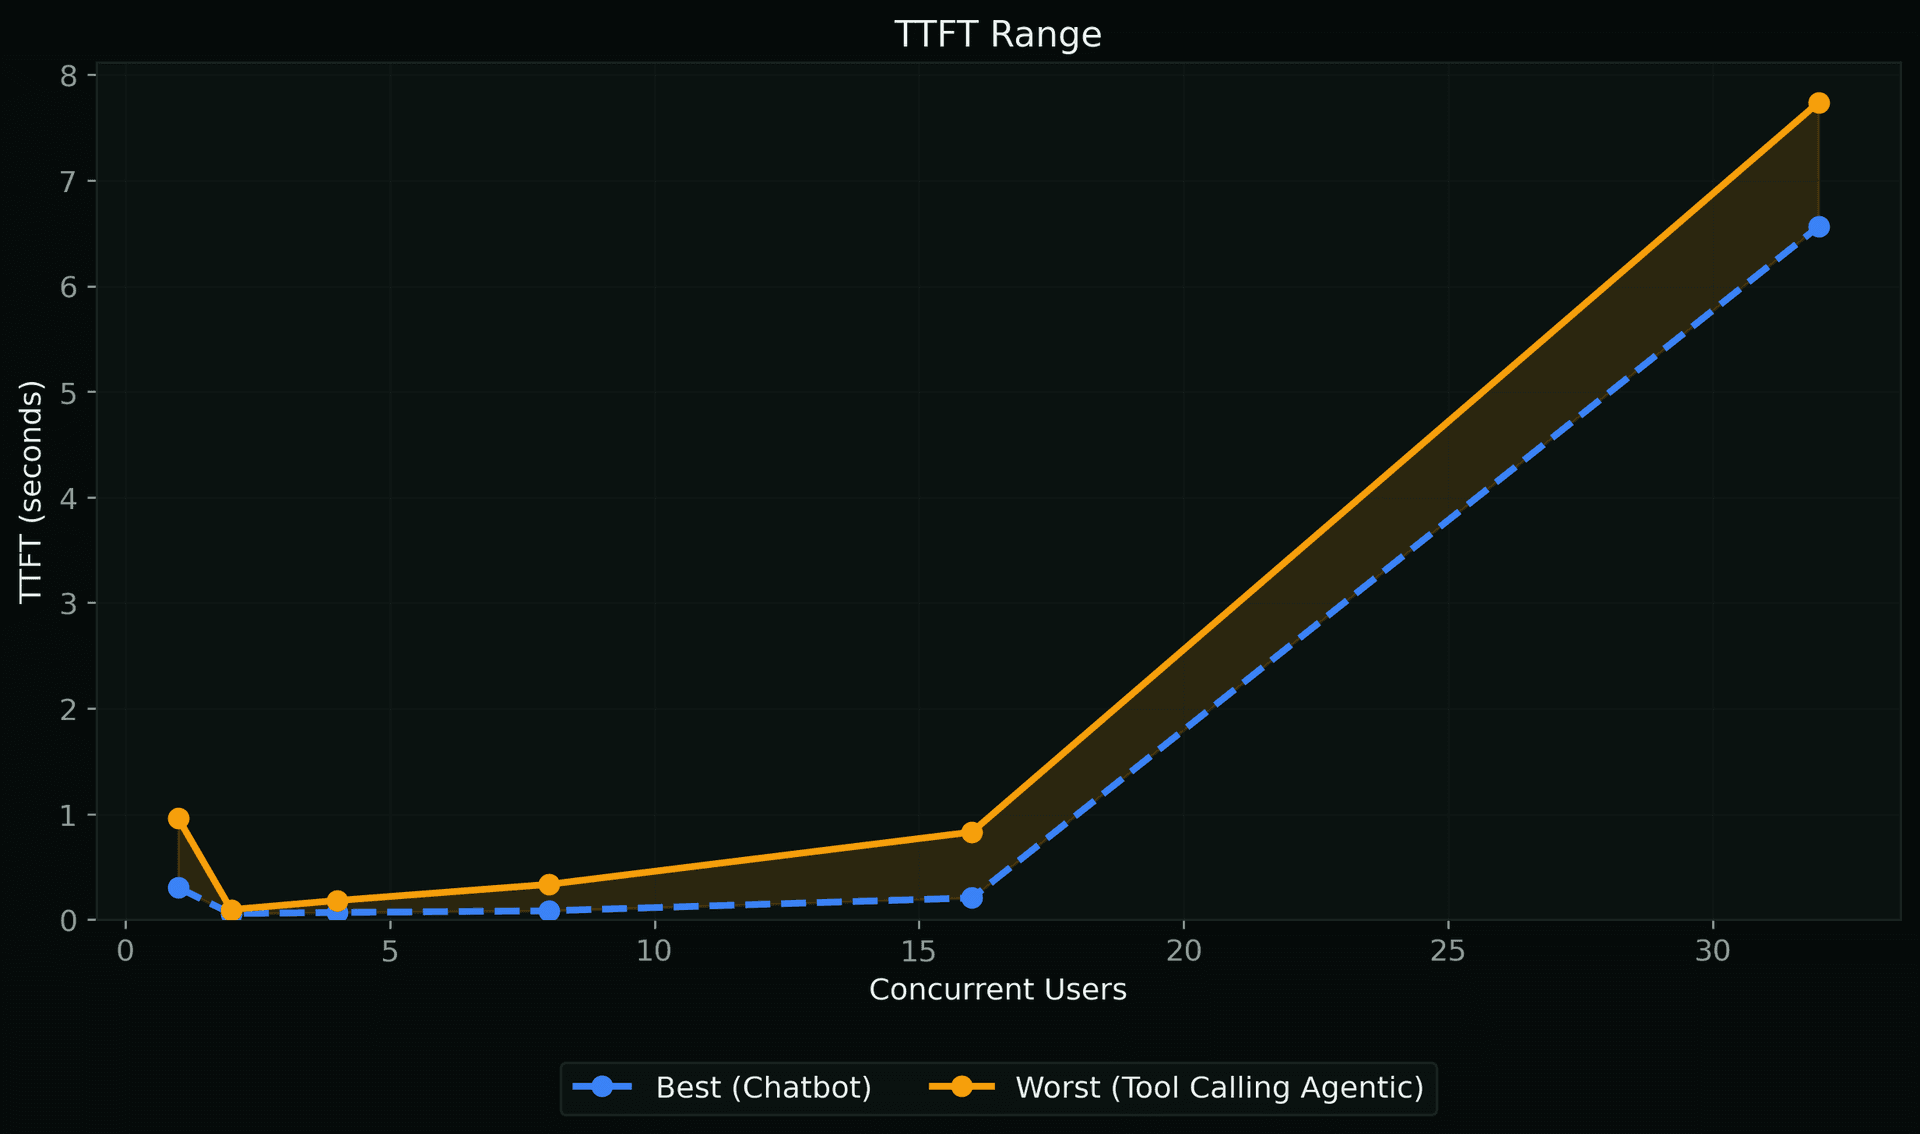
How fast is this model when the GPU is fully dedicated to my requests? We run exactly N requests simultaneously (1, 2, 4, … up to 32) with no queuing — every request gets immediate GPU attention. This isolates the hardware’s raw capability from any scheduling overhead, giving you the best-case per-user experience at each concurrency level. Use these numbers to understand the ceiling of what’s possible before real-world traffic patterns come into play.
Decode Speed per Scenario
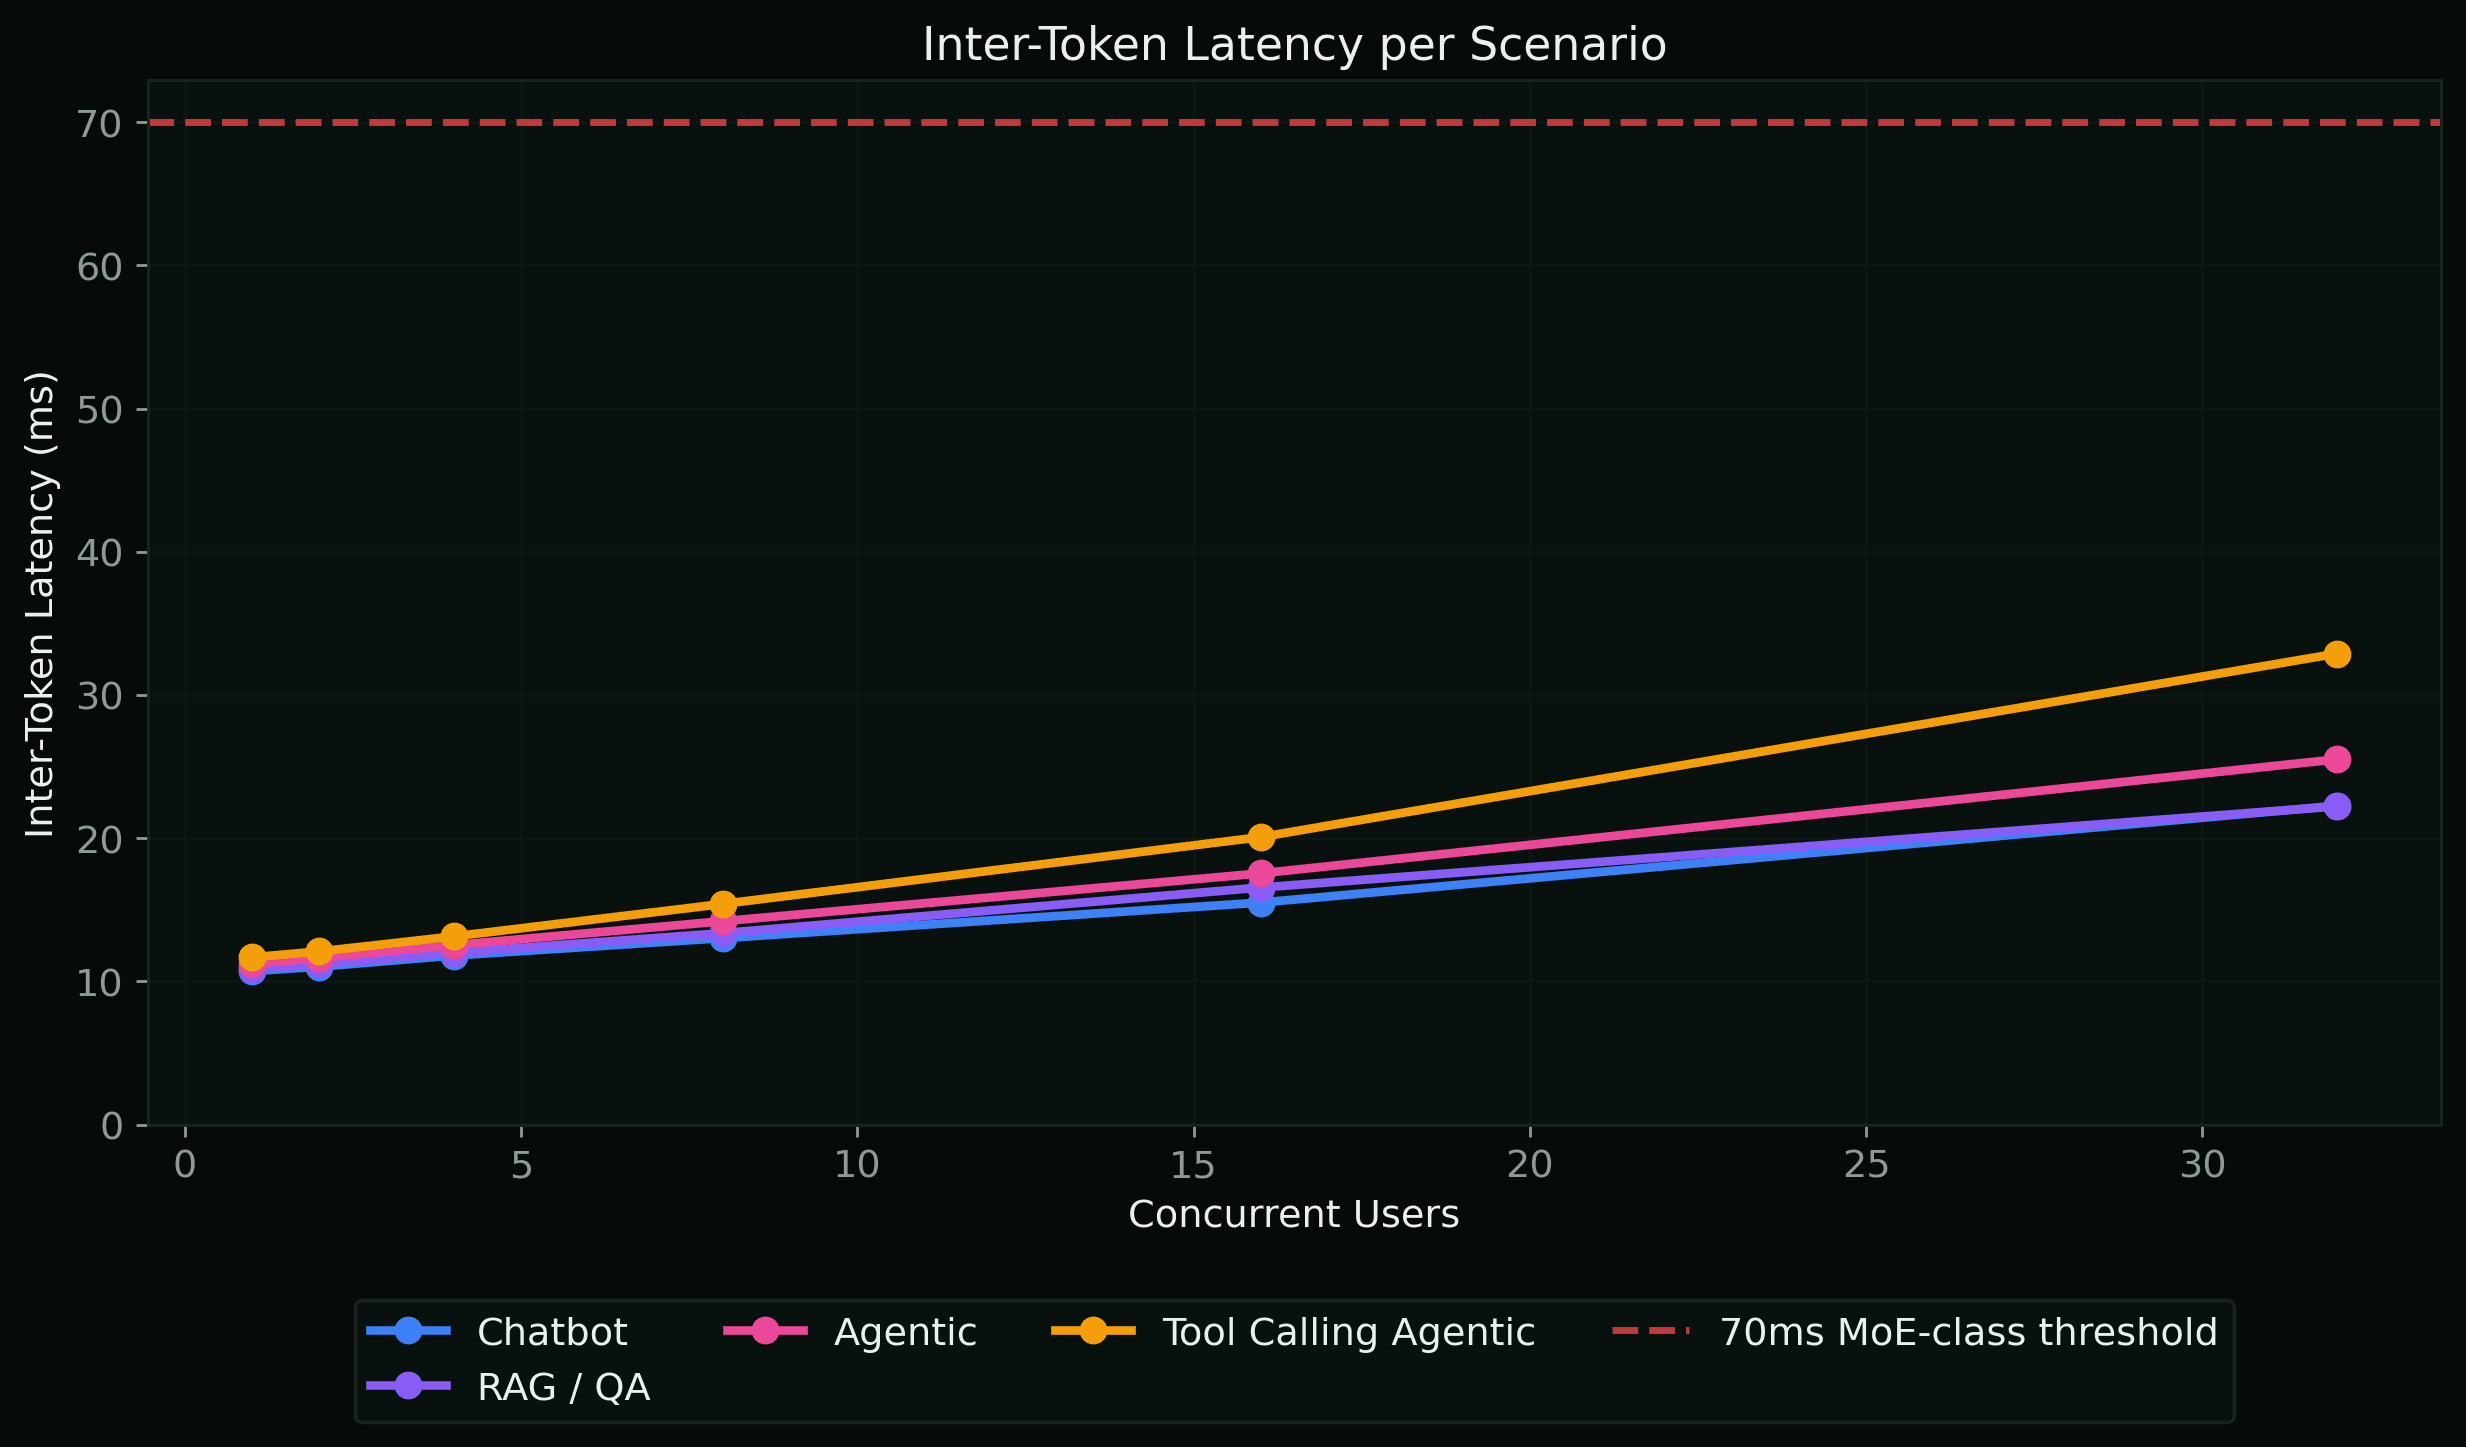
Inter-Token Latency per Scenario
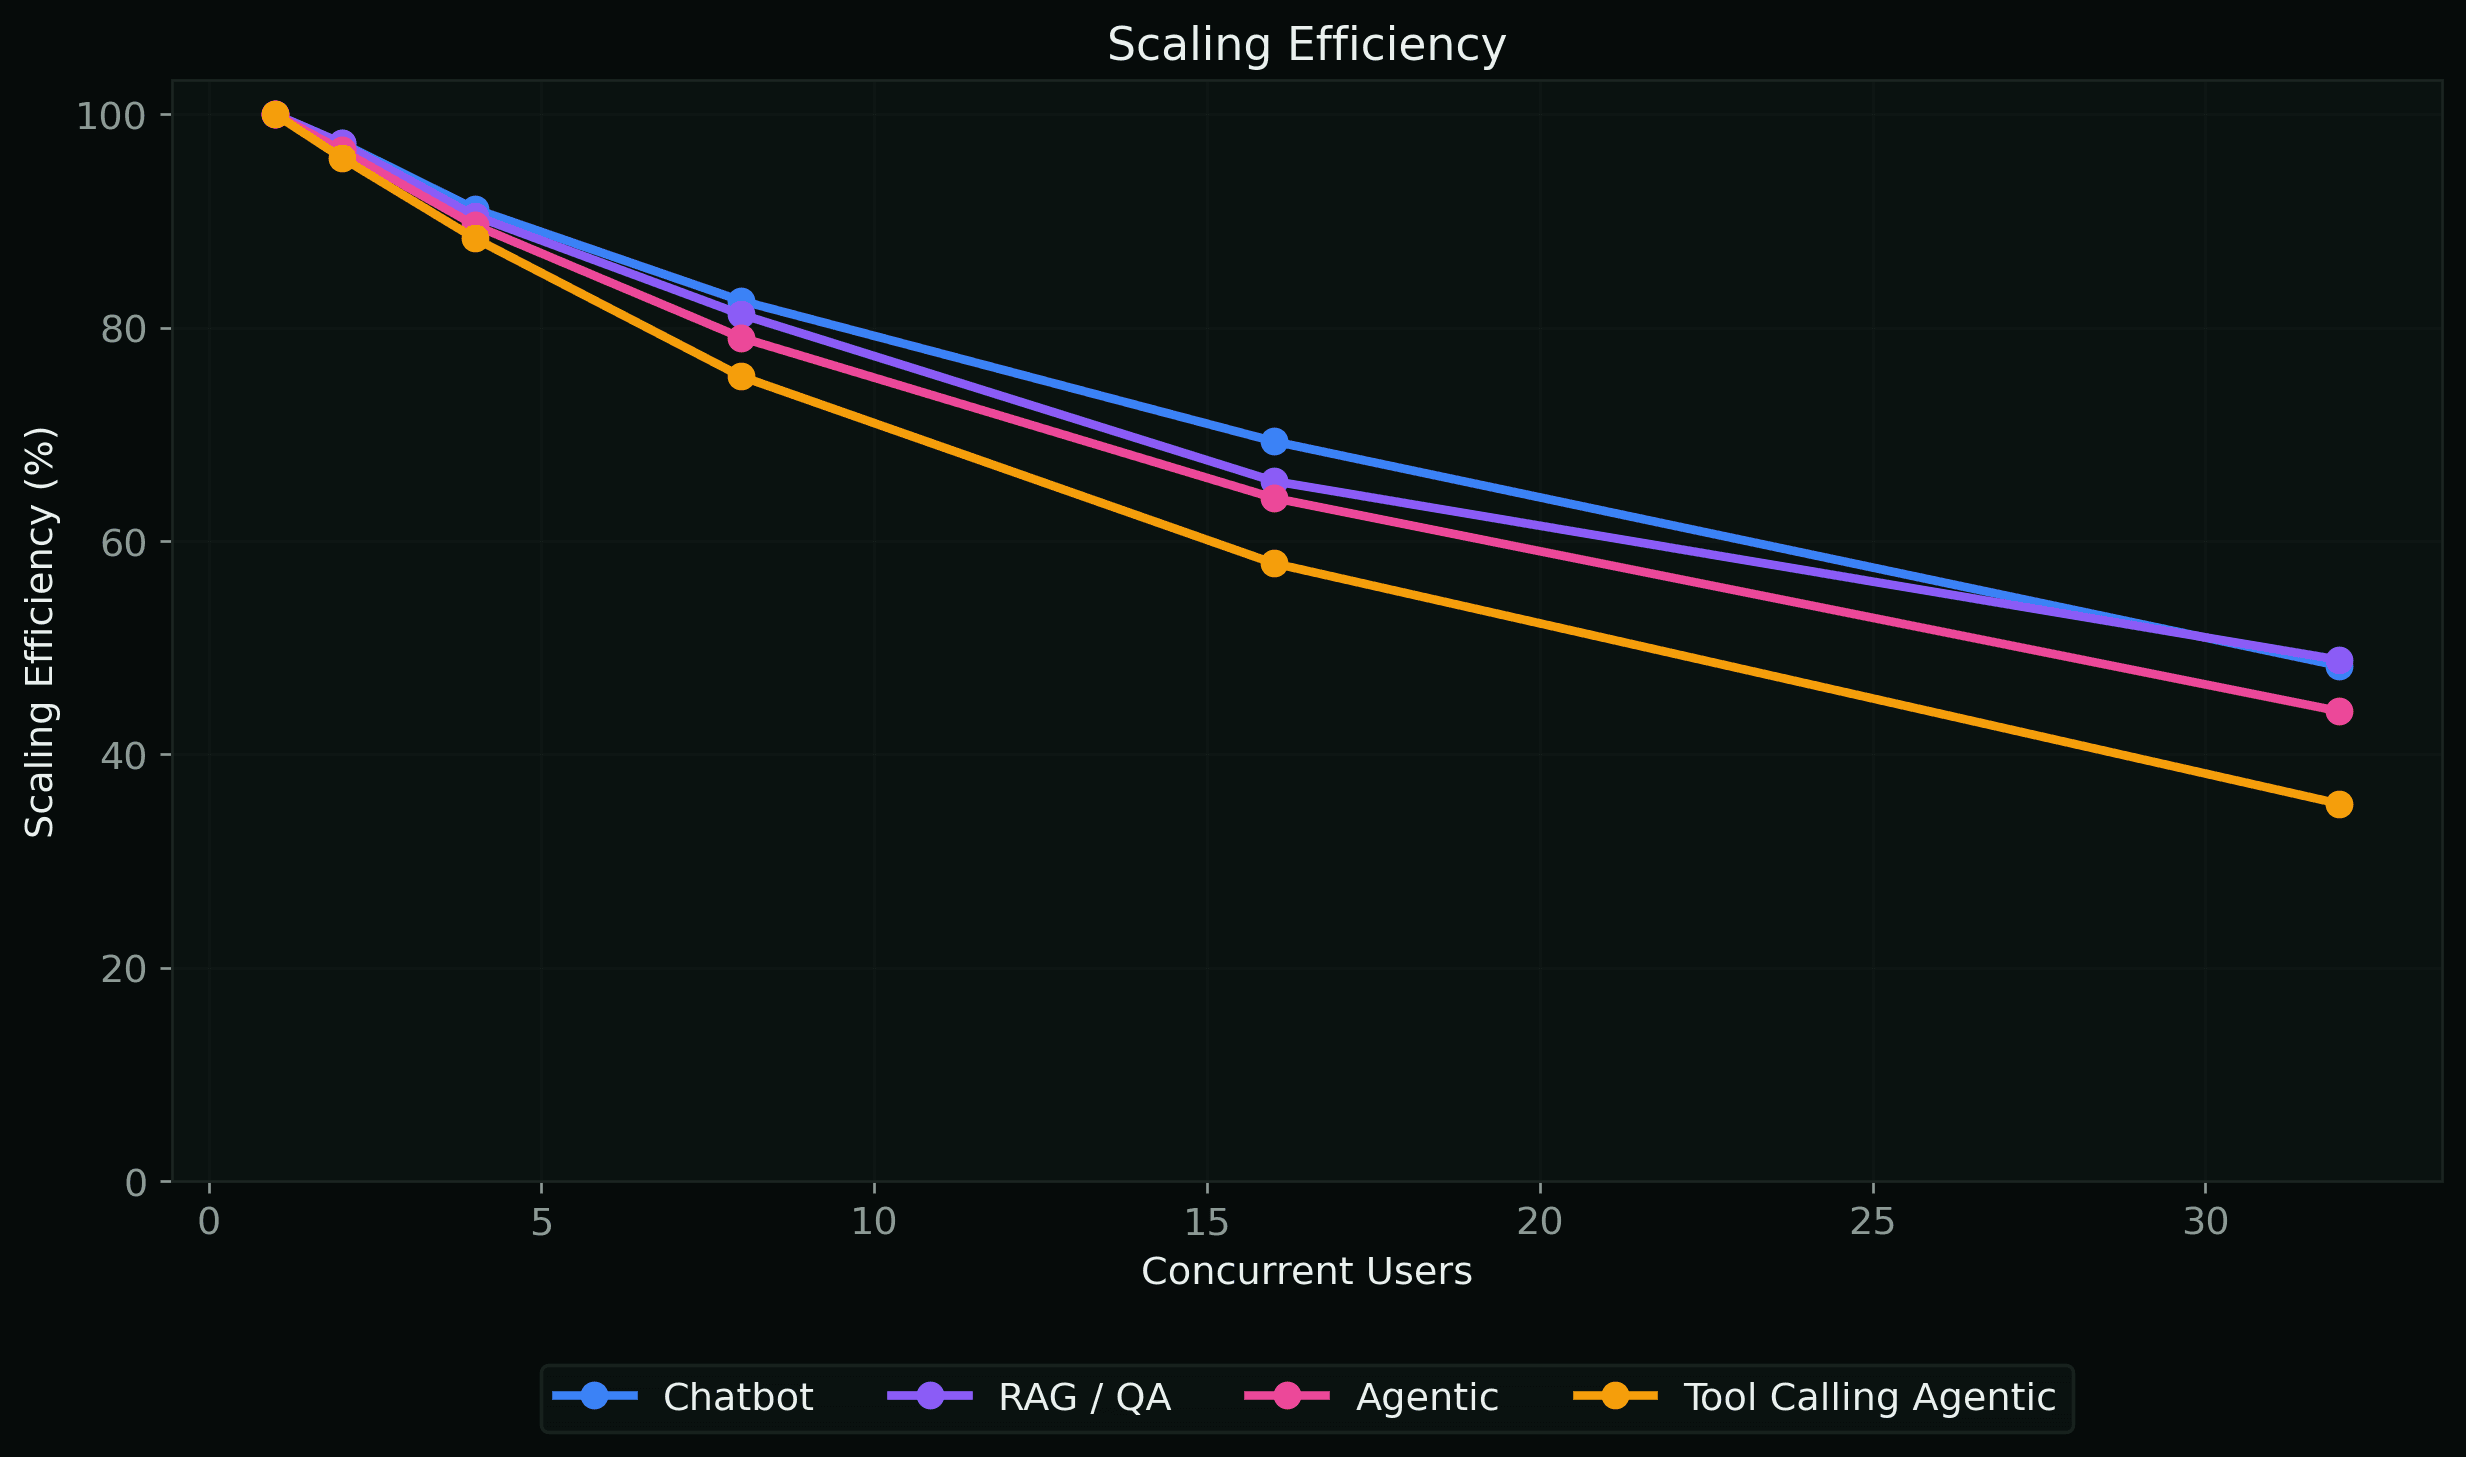
Scaling Efficiency
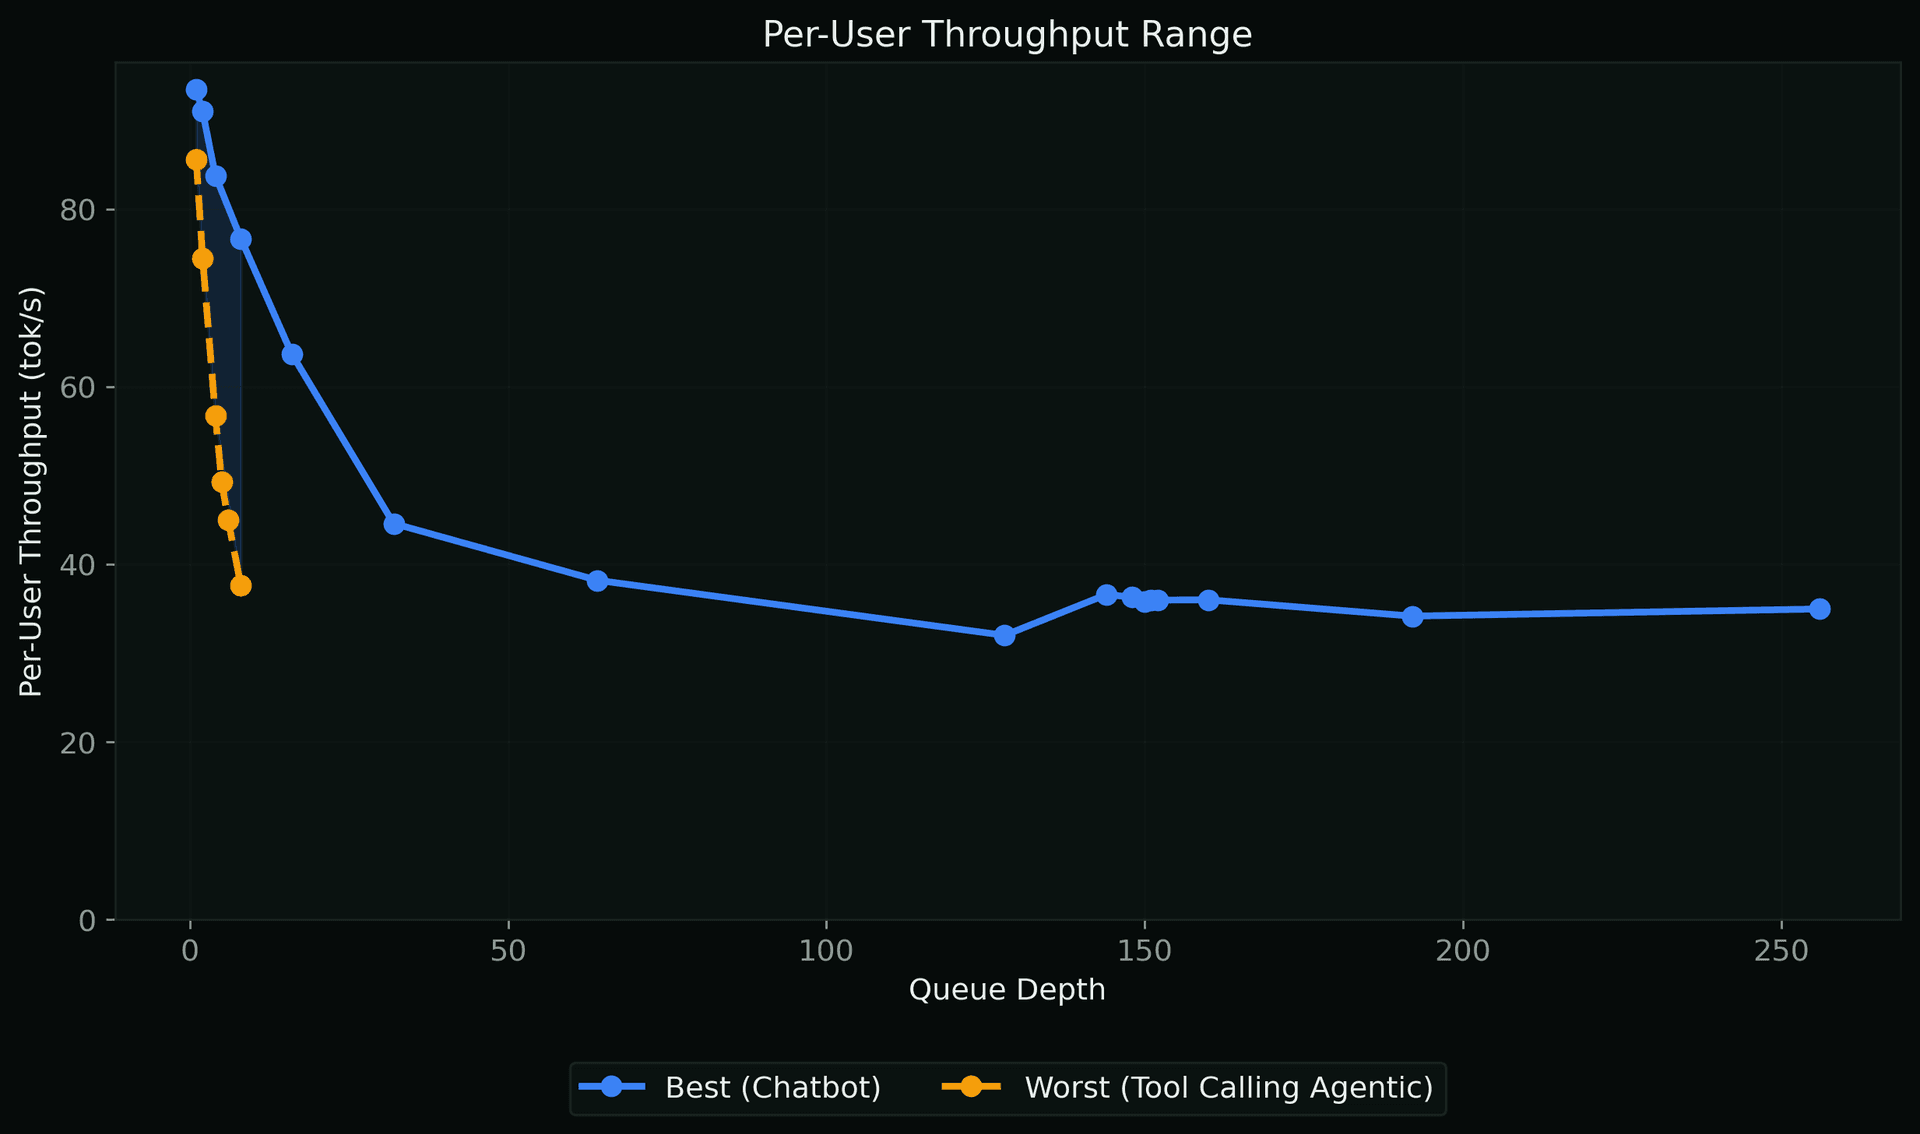
Per-User Throughput Range
TTFT Range
When to Scale Up
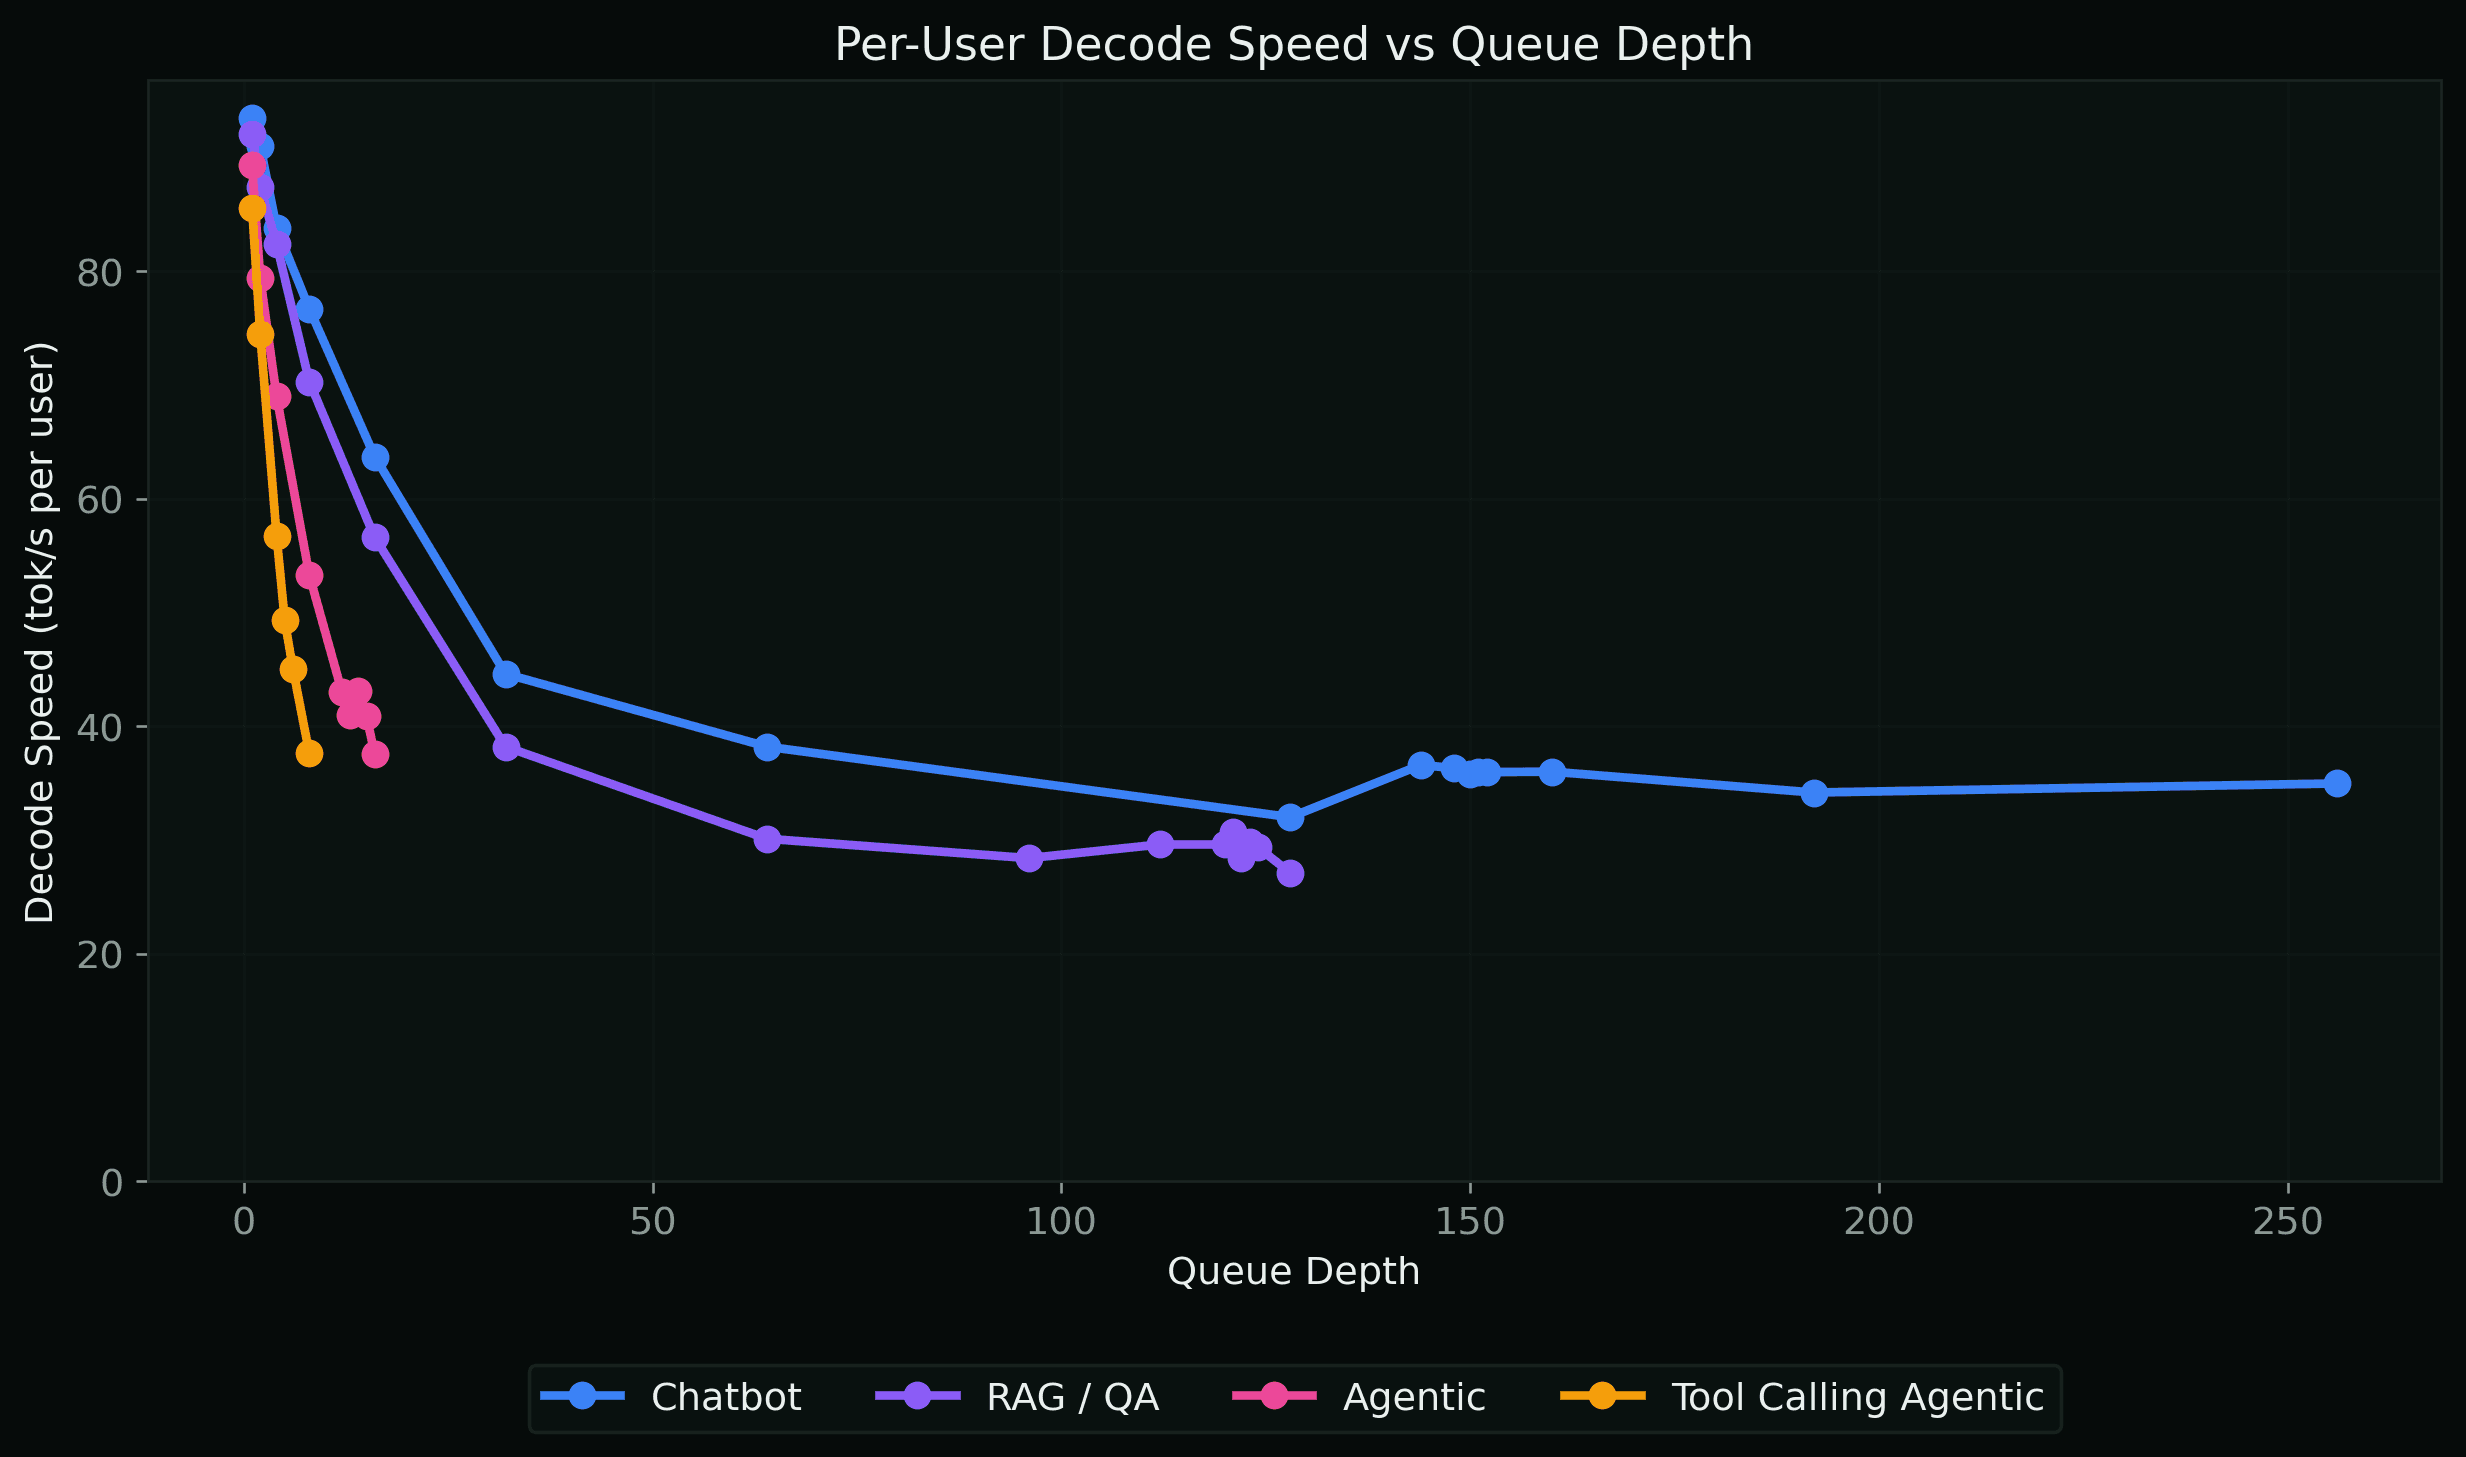
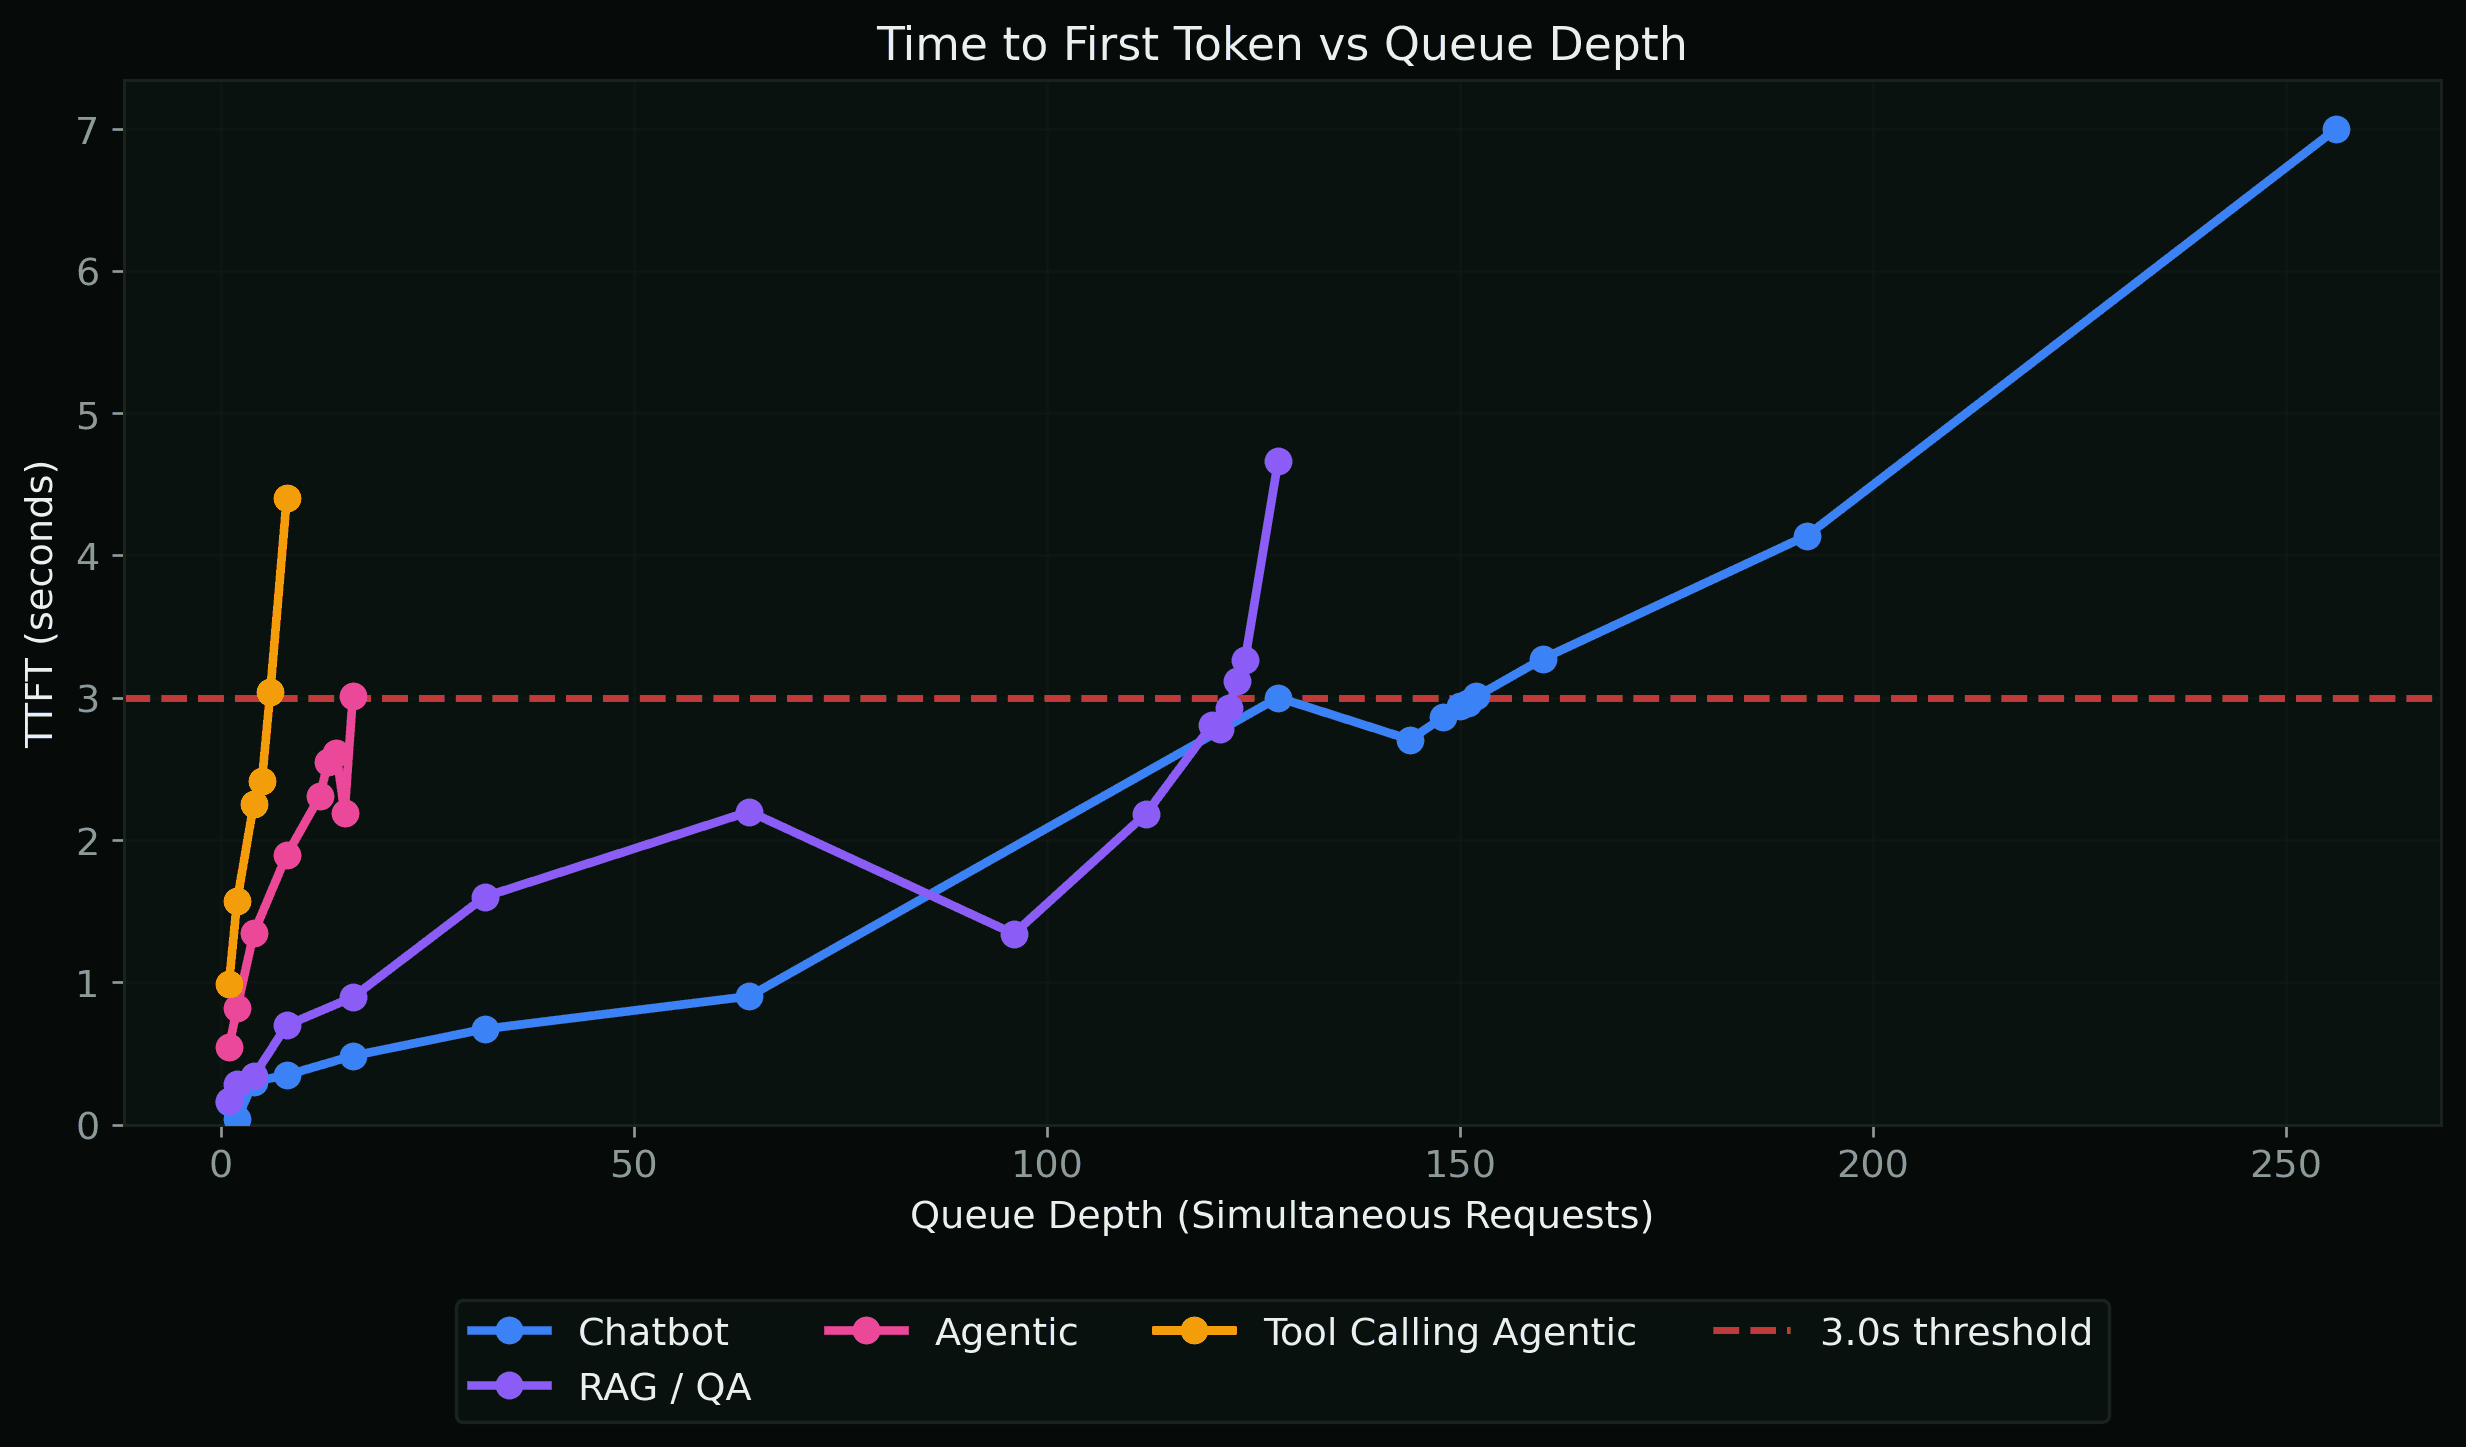
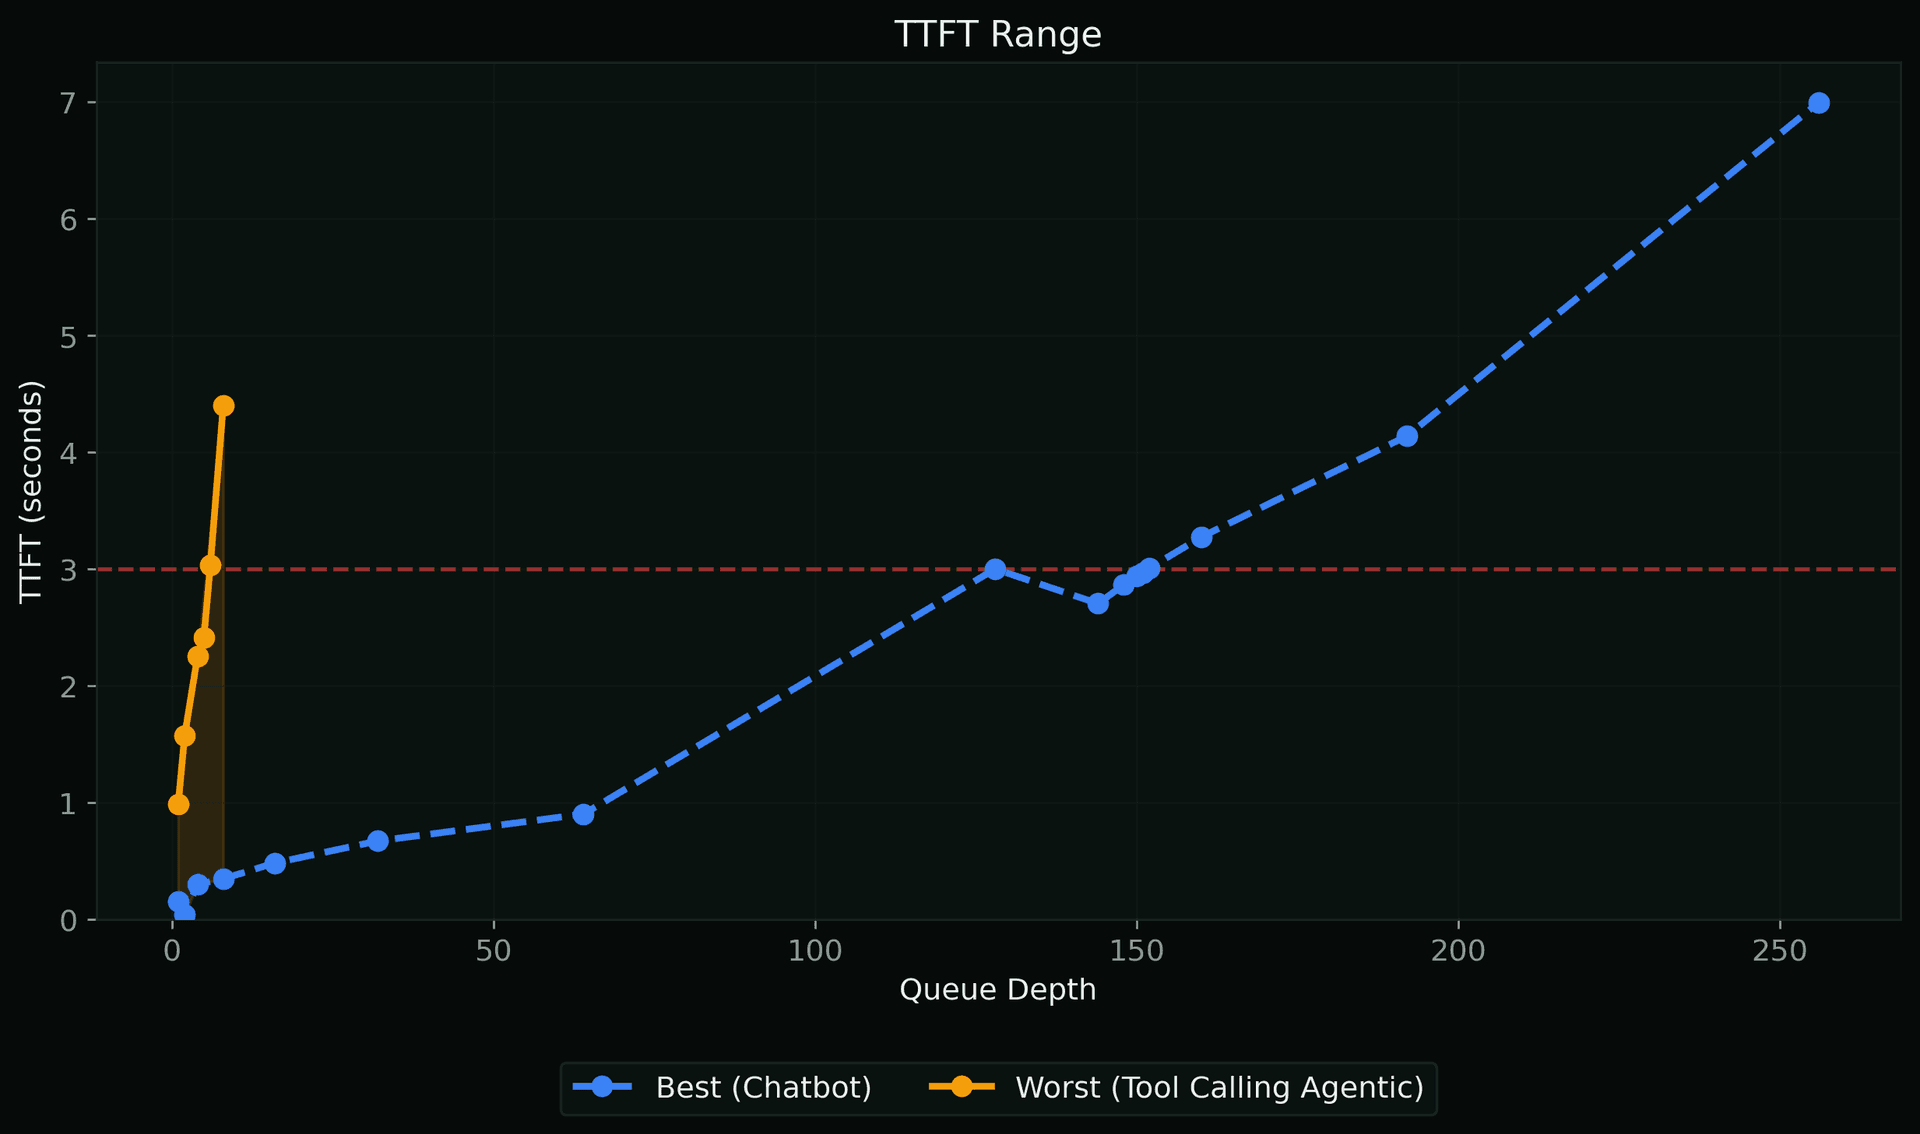
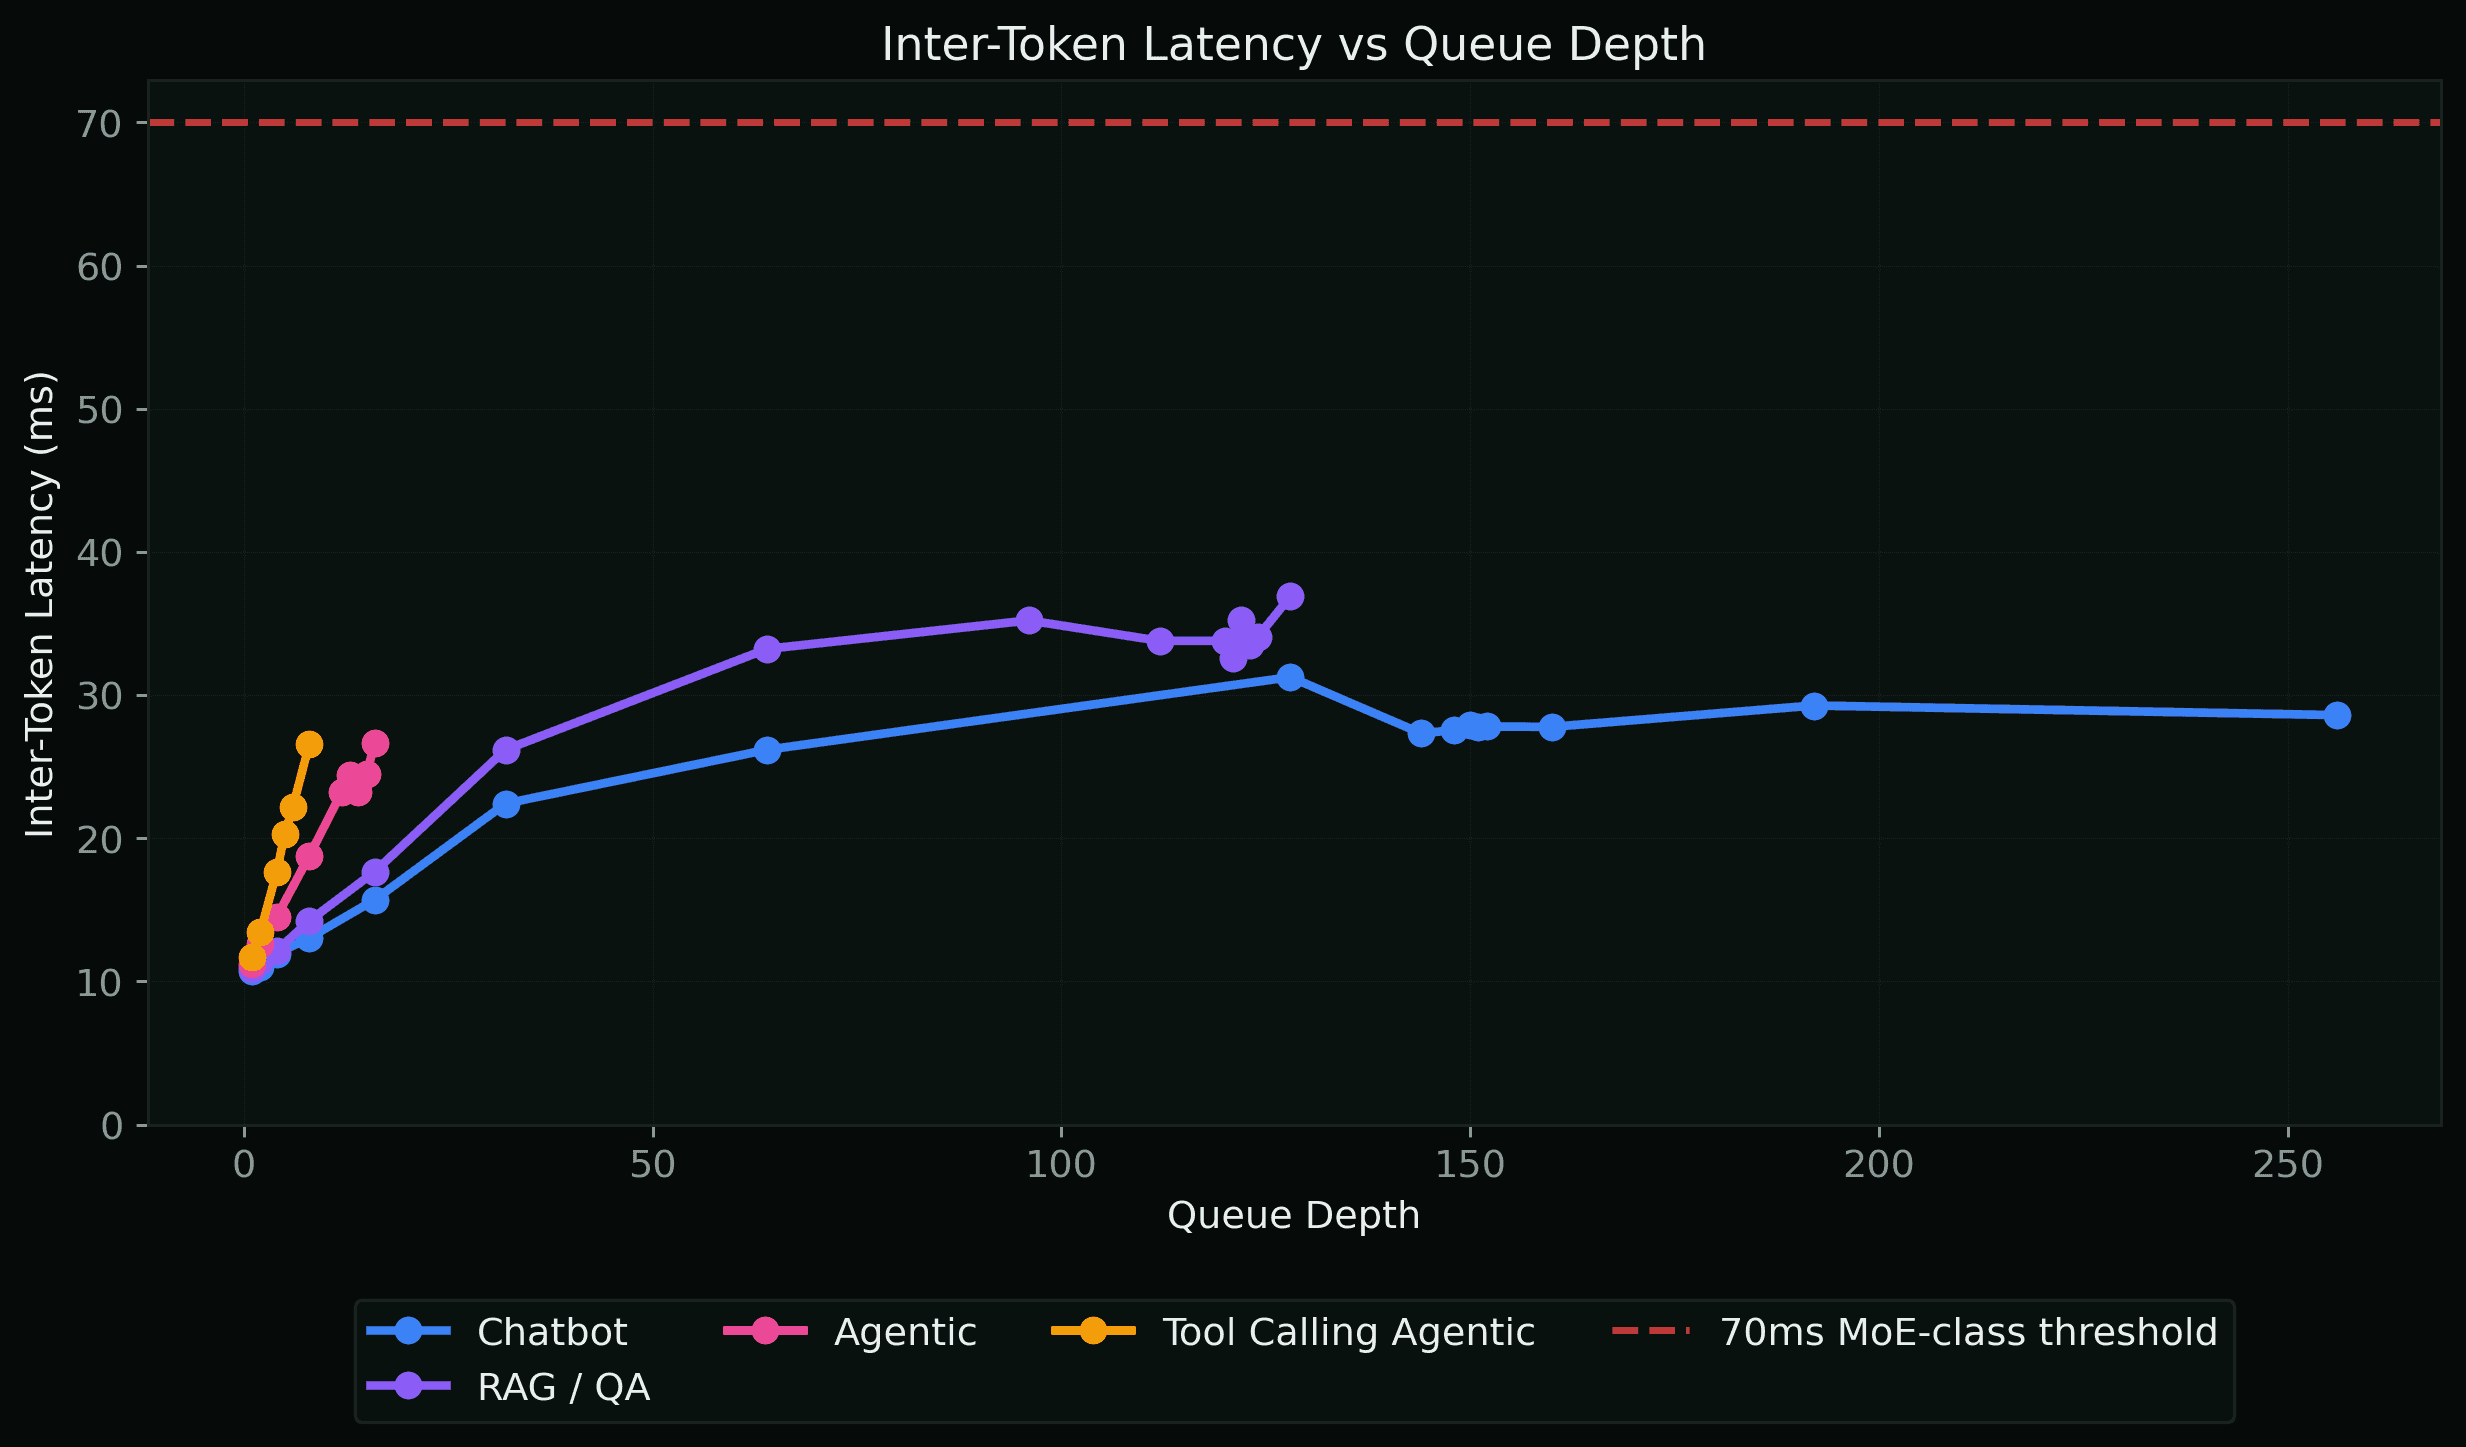
What do your users actually experience when requests pile up? Instead of holding a fixed number of requests on the GPU, we send all requests at once — mimicking a burst of simultaneous traffic. New requests must queue behind in-progress work, so TTFT climbs dramatically compared to peak conditions. The key insight: even moderate queue depths cause major delays for long-context scenarios because each prefill operation blocks the GPU for a significant duration. Use these numbers for SLA planning and capacity decisions.
TTFT vs Queue Depth
TTFT Range
Per-User Throughput Range
Inter-Token Latency vs Queue Depth
Per-User Decode Speed vs Queue Depth